Scaling and Centering
Centering and rescaling covariates is a common task prior to building
almost any sort of statistical model. Although function scale() will scale
scale and center numeric matrices, it always returns a matrix. Most model
fitting functions take data.frames. And although scale() will take a
data.frame as an input, it fails with an error if there is even one column
that is a categorical variable. That’s always bugged me, and I’ve been musing
about a solution for awhile. I’ve also wanted to try making an R package using
the fancy automation tools available in RStudio and package devtools. Today
those musings and desires collided, and I give you scaler!
install.packages("devtools")
devtools::install_github("atyre2/scaler")
The functions in this package provide type-stable
scaling and/or centering while ignoring
non-numeric columns. Like scale(), the constants used are stored as
attributes in the result, enabling automatic undoing of these operations.
This is handy for making plots after fitting the models. That bit isn’t
implemented yet, so don’t get excited.
My primary reason for putting this package together is to learn the process of making an R package. But secondarily, the scaling and unscaling of covariates is a common source of errors among students in NRES 803 Ecological Statistics. I hope that these functions will reduce those errors and make everyone’s lives easier!
I aim for these functions to be fast and to play well with pipes. Remains to be seen if those goals are met.
There are a few other alternatives to scale() out there. Steven Walker wrote
a blog post
describing a function that scales a matrix but uses the entire matrix to
calculate the centering and scaling constants. Package arm
has rescale(), which takes a single vector and scales by 2 times the standard
deviation. This is Andrew Gelman’s recommendation,
because the coefficient then refers to a change of +/- one standard devation
from the mean. rescale() also applies to binary categorical variables, but
not to categorical variatles with more levels. I’m very interested in
scaling/centering of categorical variables, but haven’t implemented any of
those ideas yet. For the moment scale_df() and center_df() just skip
non-numeric columns.
Neither rescale() nor simple.scale() work directly on data.frames. They don’t
stash the information used to scale/center anywhere convienent, so undoing
the scaling means redoing the calculations or storing that information somewhere
else. Here’s an example of the kind of problem that causes for students.
library(scaler)
library(dplyr) # for %>%
##
## Attaching package: 'dplyr'
##
## The following objects are masked from 'package:stats':
##
## filter, lag
##
## The following objects are masked from 'package:base':
##
## intersect, setdiff, setequal, unionlibrary(ggplot2)## Warning: package 'ggplot2' was built under R version 3.2.4sc_iris <- scale_df(iris) %>%
center_df()
head(sc_iris)## Sepal.Length Sepal.Width Petal.Length Petal.Width Species
## 1 -0.8976739 1.01560199 -1.335752 -1.311052 setosa
## 2 -1.1392005 -0.13153881 -1.335752 -1.311052 setosa
## 3 -1.3807271 0.32731751 -1.392399 -1.311052 setosa
## 4 -1.5014904 0.09788935 -1.279104 -1.311052 setosa
## 5 -1.0184372 1.24503015 -1.335752 -1.311052 setosa
## 6 -0.5353840 1.93331463 -1.165809 -1.048667 setosapetals_lm <- lm(Petal.Length ~ Petal.Width, data = sc_iris)
# now make a nice plot with predicted values
nd <- data.frame(Petal.Width = seq(0.1,2.5,0.1))
nd$Petal.Length <- predict(petals_lm, newdata = nd)
ggplot(iris, aes(x = Petal.Width, y = Petal.Length)) +
geom_point() +
geom_path(data=nd)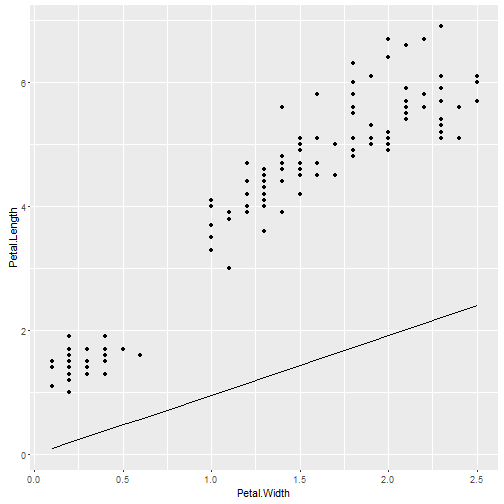
Did you catch the error? The problem is that the figure is made on the scale of the original data, but the model is fit using the scaled and centered data. What I need to do is scale the new data for prediction by the same constants as the original data, and then unscale the results so the line goes through the points. I could make the new data using the range of scaled values, but I’d still want to unscale them to put the line on the figure. I haven’t written the unscaling or rescaling code yet, so that has to wait for another blog post!
If you have any thoughts about what scaler should (or shouldn’t!) do send me
an email, tweet, or PR.